Home page
From the home page of the web server, it is possible to query the model database in two ways:
-
UniProt accession: the accession is searched against the database and, if present, all data for the entry are shown. Otherwise, an error message is displayed prompting the user to go back to the home page.
The same search functionality is available also outside the home page, through the “Quick search” field in the navigation bar at the top of each page.
-
FASTA sequence: the protein is aligned against all the sequences present in our database using BLAST. Depending on the results, a list of at most 10 entries is displayed.
-
If a perfect match is found, only the corresponding entry will be displayed.
-
If at least one significant match is found, the best significant hits will be displayed. We consider a hit to be significant if it has an e-value lower than 0.001 and a sequence identity greater than 50% over a coverage greater than 70%.
-
If no significant match is found, the best hits will be displayed alongside a warning message.
-
If no hit is found, an error message is displayed prompting the user to go back to the home page.
Search page
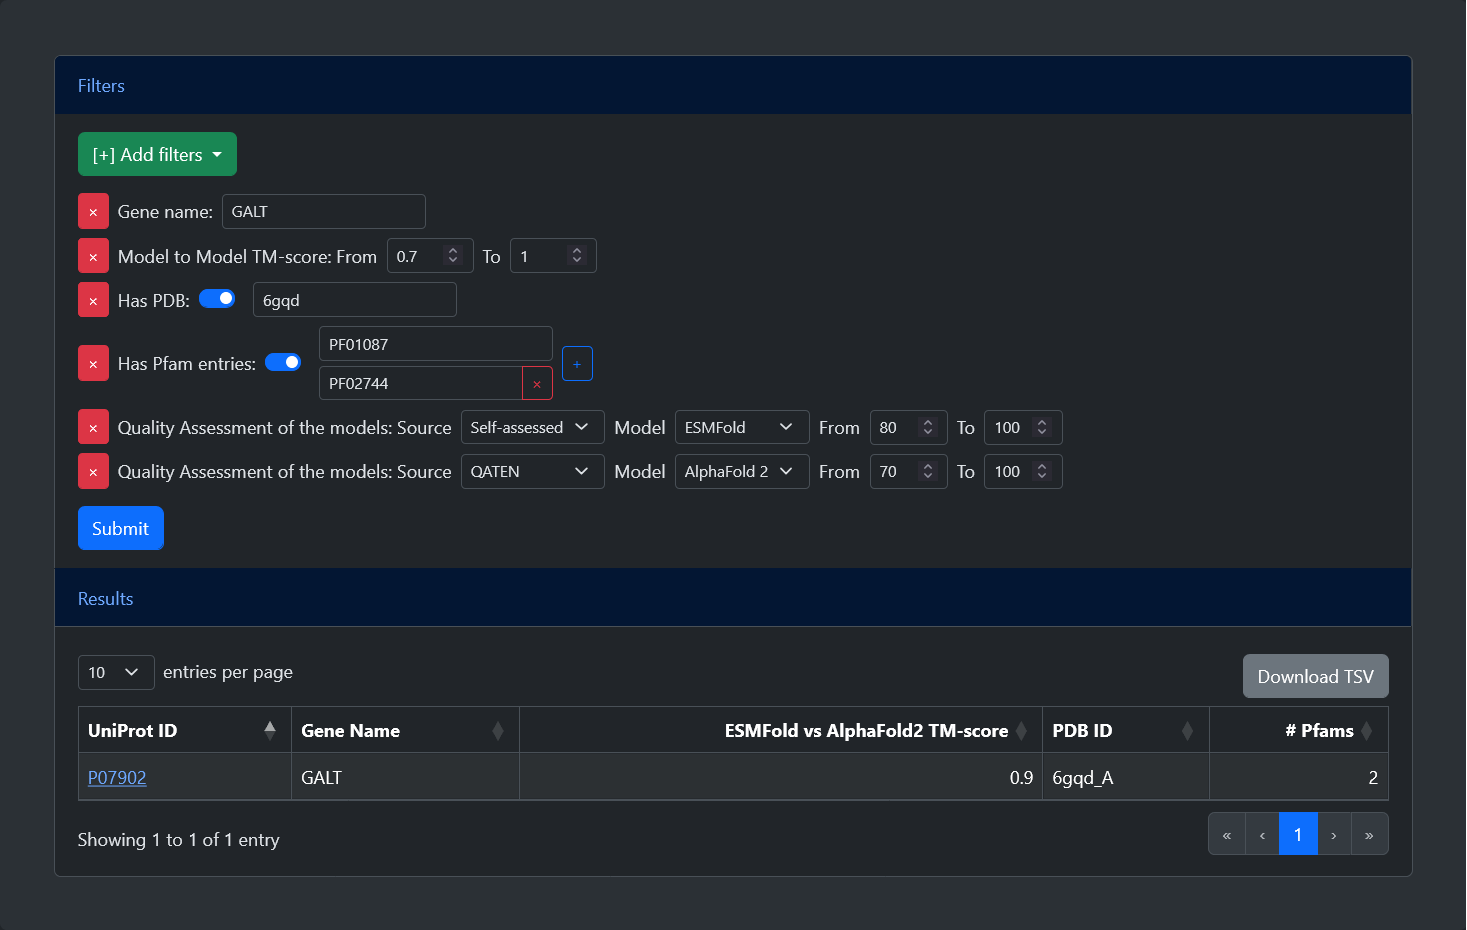
The advanced search allows users to select and apply different filters. After pressing the submit button, a table will be generated with all entries which satisfy the criteria. Below, is a list of all available filters:
-
Gene name: Entries can be filtered by their gene name. Leaving this field empty after selecting the filters will select all possible entries.
-
TM-score: Entries can be filtered based on the TM-score between the ESMFold and AlphaFold2 models. The TM-score goes from 0 (no overlap) to 1 (perfect overlap) and the user can set the minimum and maximum values. The default range from 0 to 1 selects all possible entries.
-
Has PDB: Entries can be filtered based on the availability of an experimental structure. After selecting the filter, a switch can be turned on or off to select only entries with or without a PDB structure. If the flag is turned on, it is also possible to search for a specific PDB ID.
-
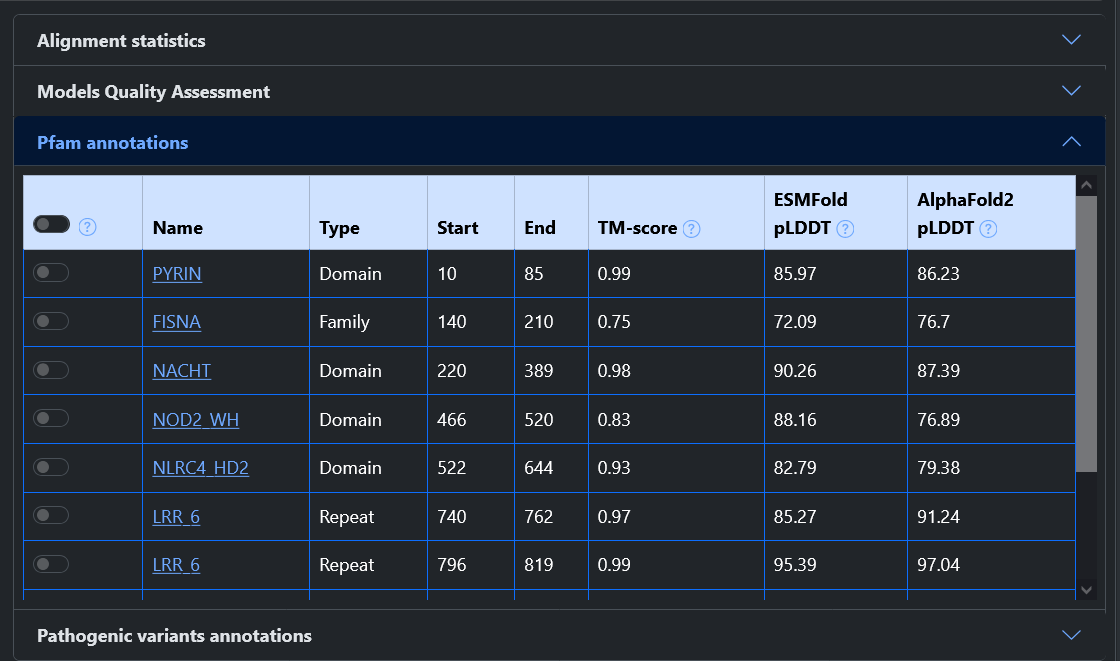
Has Pfam: Entries can be filtered based on the availability of functional annotation. After selecting the filter, a switch can be turned on or off to select only entries with or without annotated Pfam entries. If the flag is turned on, it is also possible to search for a specific Pfam ID. A "+" button allows to add as many fields as desired, allowing users to search for proteins with all specified Pfam entries.
-
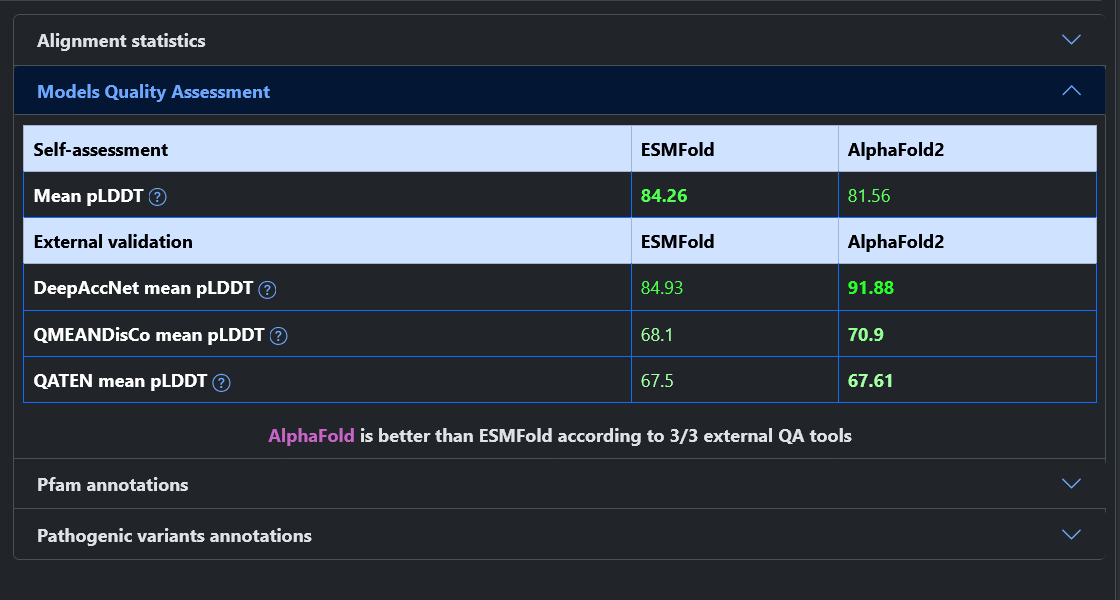
Quality Assessment:Entries can be filtered based on the quality of the models, expressed by their pLDDT. After selecting the filter, it is possible to specify the source of the pLDDT (either Self-assessed, indicating the score given in output by the methods, or one among three external Quality Assessment tools, namely DeepAccNet, QMeanDISco, or QATEN), the model (either ESMFold or AlphaFold 2), and the minimum and maximum values of the pLDDT (between 0 and 100). This is the only filter which can be selected multiple times, allowing the selection of different criteria
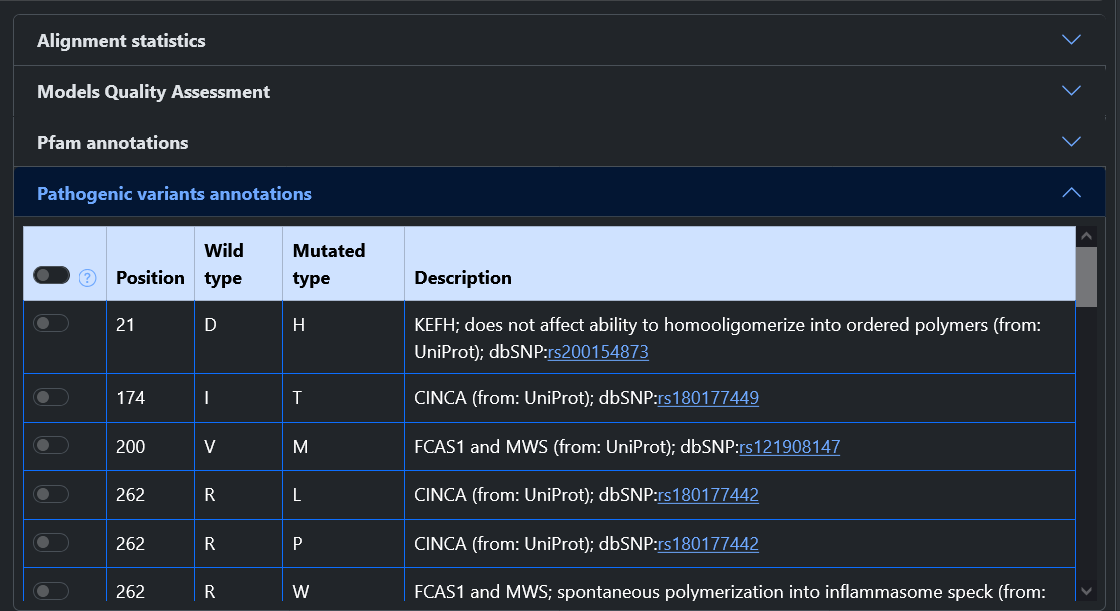
Results page
For all entries in the model database, the results page shows multiple information.
Examples
We show here four cases to clarify how the different statistics can be interpreted.
-
Example 1 - High-Quality models and Good Superimposition: P07902
-
At the top of the page we can see that this protein is reviewed, that it has a length of 379 residues and that it has a PDB structure covering 91% of the sequence.
-
In this example, both models have good quality since about 90% of residues are predicted with high pLDDT. When this is the case, we usually expect to observe a good superimposition. Indeed, the two models have a very high TM-score (0.9), which approaches 1 if we consider only residues with a higher pLDDT. Looking at the model superimposition, we observe that only the first helix of the protein and a few loops are misaligned, but the majority of the protein is correctly superimposed.
-
When comparing both models to the PDB structure, we see that the first helix that could not be superimposed is not covered by the PDB structure. Overall, both models have a high TM-score, with the AlphaFold2 model being slightly better.
-
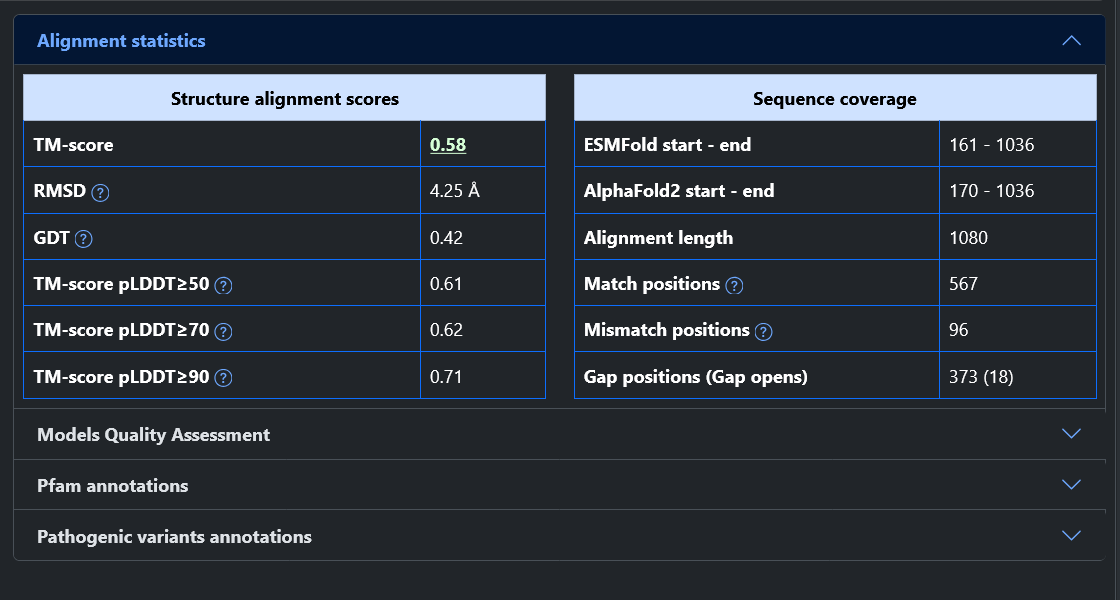
Example 2 - High-Quality models but Poor Superimposition: Q96P20
-
At the top of the page we can see that this protein is reviewed, that it is quite long (1036 residues) and that it has a PDB structure covering almost the entirety of the sequence.
-
In this example the two models are high-quality, having about 80% of residues predicted with high pLDDT. Despite that, the two models have a poor TM-score (0.58), although it improves if we consider only residues with a high pLDDT (up to 0.71). Looking at the model superimposition, we observe that the first part of the protein is not aligned (about 430 residues, mostly due to a domain rotation), negatively impacting the TM-score.
-
When comparing the models to the PDB structure, it appear that the region where the models agree is well superimposed with the experimental structure. Conversely, the first portion of the protein appears to be misplaced in both models. The ESMFold model is closer to the structure and therefore the TM-score is higher for ESMFold (0.73) than for AlphaFold2 (0.57).
-
Example 3 - Low-Quality models and Poor Superimposition: Q9NVL8
-
At the top of the page we can see that this protein is reviewed, that it has a length of 296 residues and that it lacks an experimentally annotated structure. For this reason, we will limit our observation to the comparison between the two models.
-
In this example, both models are low quality. The AlphaFold2 model has only about 22% of residues with a pLDDT greater than 70, while the ESMFold model has only one residue. As expected, this correlates with a very poor TM-score (0.2). Looking at the model superimposition, we observe agreement only in one helix, while the majority of the models are misaligned.
-
Example 4 - Low-Quality models but Good Superimposition: Q9HD87
-
This is a short (102 residues) reviewed protein, that does not have an associated experimental structure.
-
In this example, both models are low quality, not having any residues with a pLDDT greater than 70. Despite that, they have a high TM-score (0.72). Looking at the model superimposition, we observe that most of the structure is aligned, the main difference being a 11 residue long alpha-helix at the N-terminus of the protein. Just like for the second example, this protein represents a rare case where the quality of the models does not correlate with their agreement.